Solar Insolation for North America
What is Solar Insolation?
Solar insolation is how the measurement of average daily solar radiation is expressed. It's stated as a daily value called insolation hours. The hours of insolation are equal to the average daily kilowatt hours received per square meter. Each 1 kWh/m^2 of average daily energy is defined as one hour of solar insolation. It does not mean "hours of sunlight". For example, depending on cloud patterns, an area with 11 hours of daytime may only receive a total of 5000 watts of solar energy per day per square meter, that area would have a solar insolation of 5.0 hours.
Solar Insolation Chart
This insolation chart shows the average daily hours of solar insolation for the United States. Charts or maps such as the one below accurately predict the annual insolation of an area and can be used to determine the needed size of a solar energy system or to calculate future energy production.
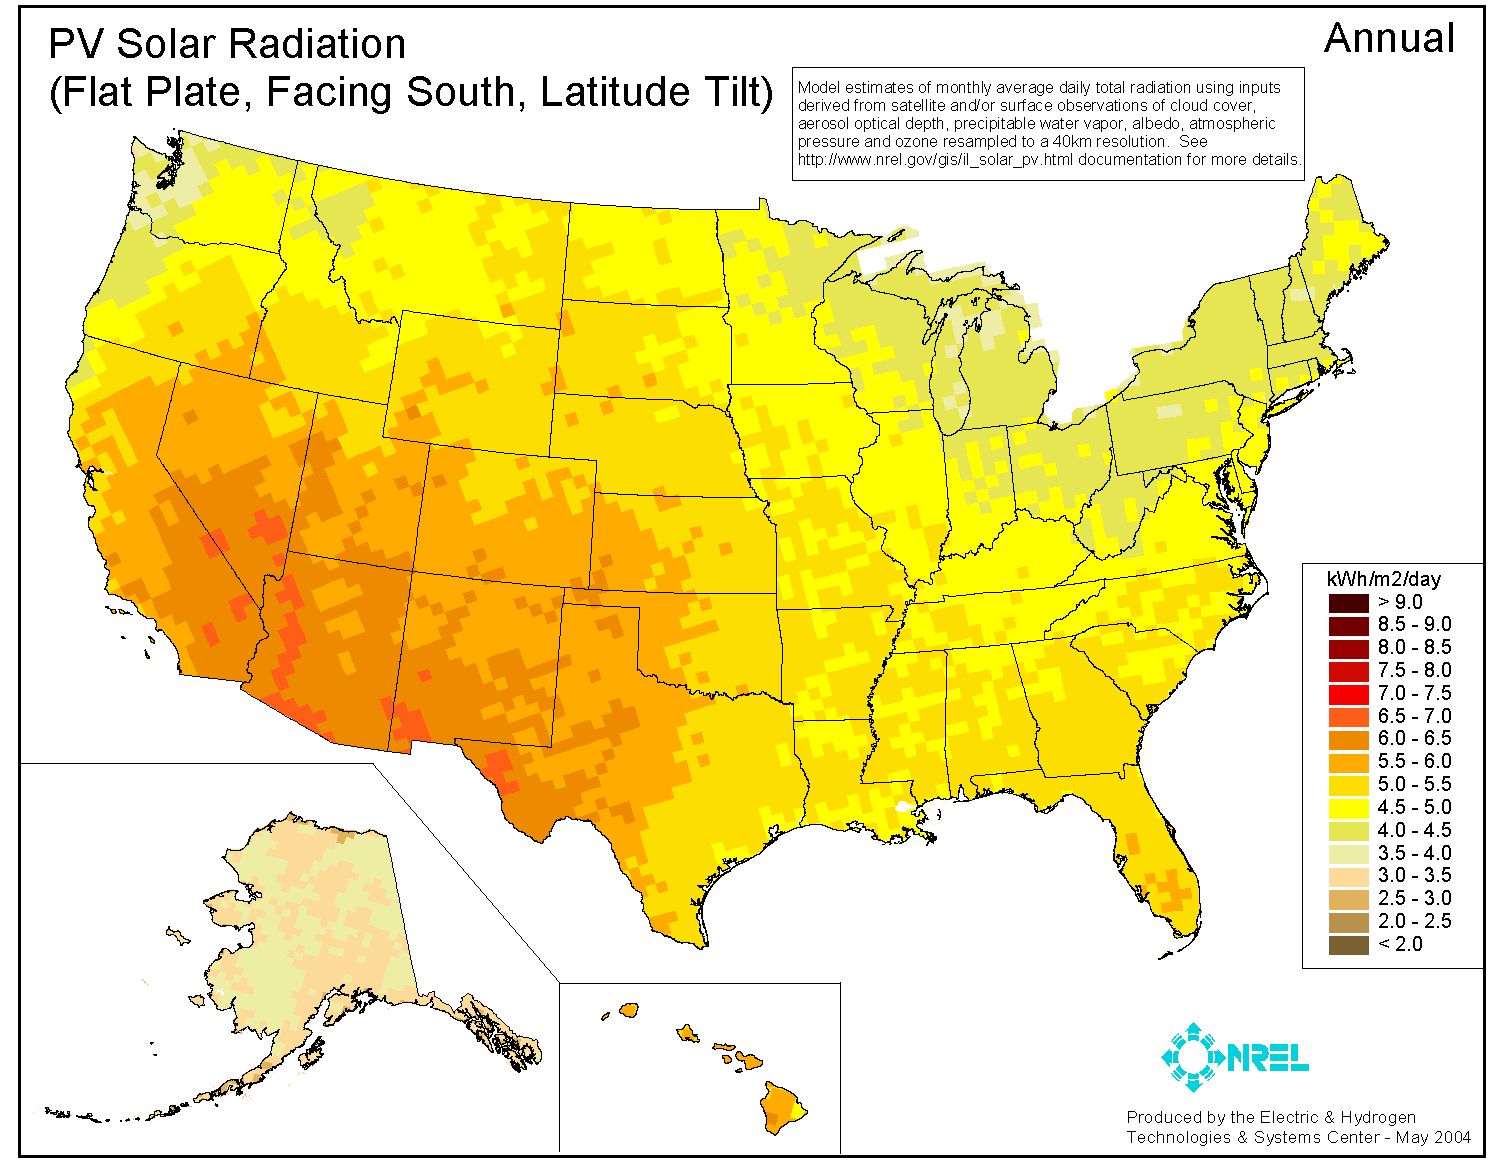
You can download a solar insolation chart for a specific month, angle, or output using the resources found at the National Renewable Energy Laboratory's (NREL).
Using Solar Insolation Charts
Solar insolation charts are used for system sizing, and calculating the output of solar PV and thermal systems throughout North America.
Our technical support team assists our dealers in solar system design, sizing, and output calculations using charts such as these. If you would like assistance in solar system design or output projections, a service we provide to our network of dealers, please contact us.